lighthouse-dashboard
![]()
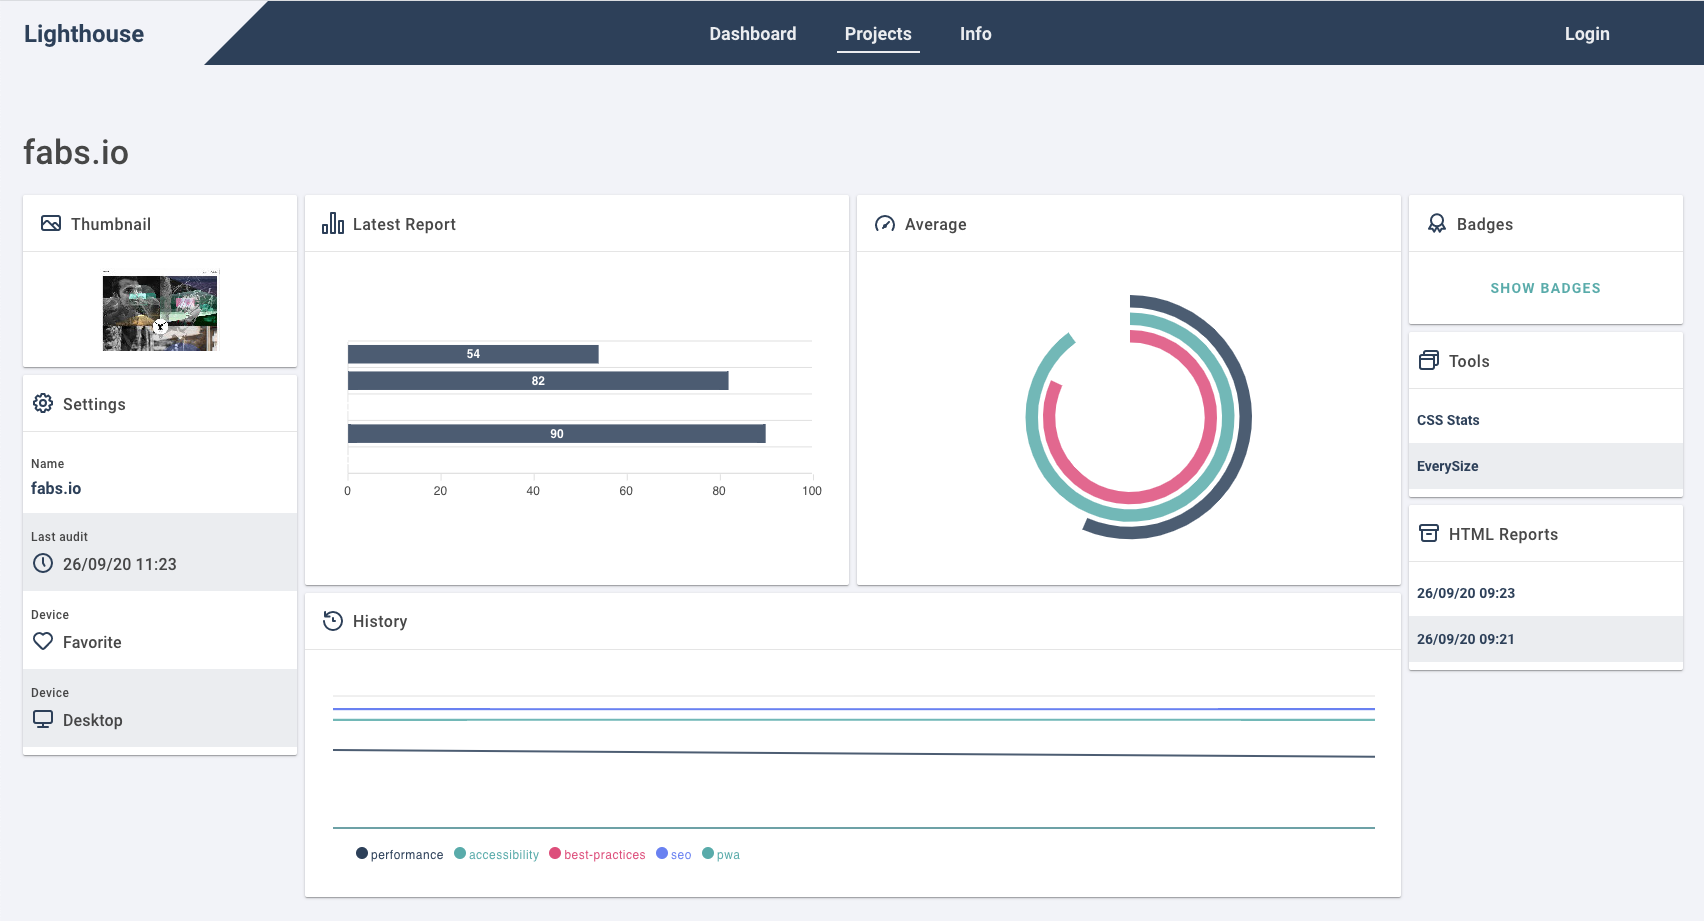
A dashboard to keep track on the performance of your sites
Frameworks
Datatbase: mongodb
Backend: hapi
Frontend: Vue
Routes
Swagger (only for NODE_ENV=development)
Architecture
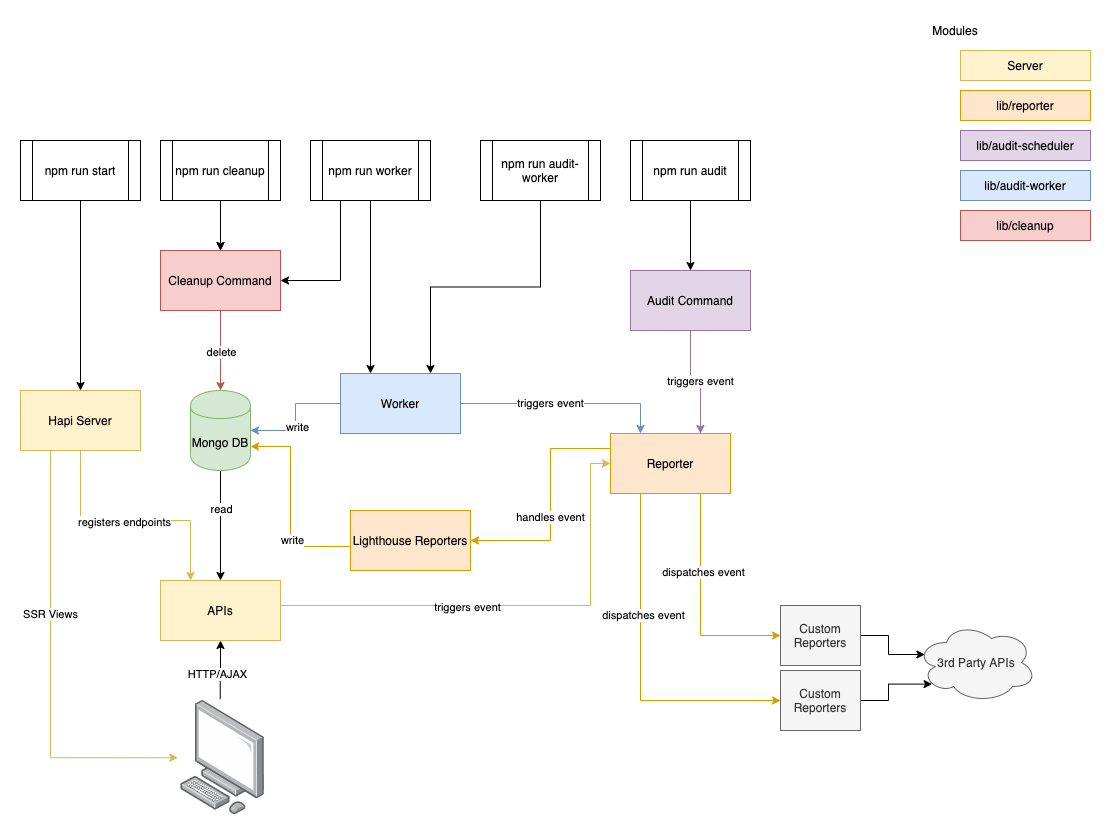
The app is split into two main parts. The UI and the worker. The UI is responsible to provide the dashboard view via HTTP. The worker runs the audits of the projects in the background. The worker consumes messages stores in the message queue and runs lighthouse to create new audits. The results will be stored in the mongodb. The UI will consume those messages via an API.
Env Variables
| name | required | type | description | example |
|---|---|---|---|---|
| LOGIN_PASS | true |
string |
used for login | foobar |
| JWT_SECRET | true |
string |
secret used for the jwt token | asdf123 |
| MONGODB_URI | true |
string |
URI for the DB connection | mongodb://admin:admin@database:27017/auditreports |
| PORT | true |
number |
port number | 5000 |
| SENTRY_DSN | false |
string |
sentry DSN string | https://776d9de9782447ae87ffbcc03d24f6ad@sentry.io/1890421 |
| WINSTON_LOG_LEVEL | false |
info,debug,error |
Log level for the winston logger | info |
| G_ANALYTICS_ID | false |
string |
Google Analytics ID for tracking | GA-XXXXX-X |
| WINSTON_LOG_FILES | false |
boolean |
Define if logs should be stored in the /logs folder |
true |
| GOOGLE_CHROME_BIN | false |
string |
Point to the chromium binary | is set by the buildpack |
| GOOGLE_CHROME_PORT | false |
number |
Define the port used for remote debugging | 9222 |
| ALLOW_ANONYMOUS_VIEW | false |
boolean |
With this flag, you can allow not authenticated user to browse reports which are linked to a page wich is marked public |
true |
| MAX_REPORTS_AGE | false |
number |
The amount of days a Raw report should be stored. Depends on the amount of storage you have available | 7 |
| ENABLE_STORYBOOK_VIEW | false |
boolean |
Whether to expose the storybook build in http://localhost:4000/storybook or not |
true |
Config
Commands
npm run start
The UI is simple to run. Simply provide all environment variables described below and run npm run build to build the frontend
and then npm run start to boot the server
npm run worker
The worker checks the database for pending audits. If there are some, the lighthouse audit will be performed for those sites.
Run the worker via npm run worker. I recommend to do this via a cronjob every 10 minutes.
So you can create new reports via the frontend and don’t have to wait too long to be created.
npm run audit
This command creates a new audit for every site configured. I recommend doing this every 6 to 12 hours.
Run the command via npm run audit
Development
First create a .env file in the project root.
It’s content should be like shown below.
After that, you could start your local server with
npm run dev-server which will restart after any change in the /src directory.
To constantly recompile the frontend just run npm run dev and all Vue, JS and SCSS assets are compiled
on changes.
Hosting
Heroku
This app works perfectly fine with heroku and MongoDB Atlas.
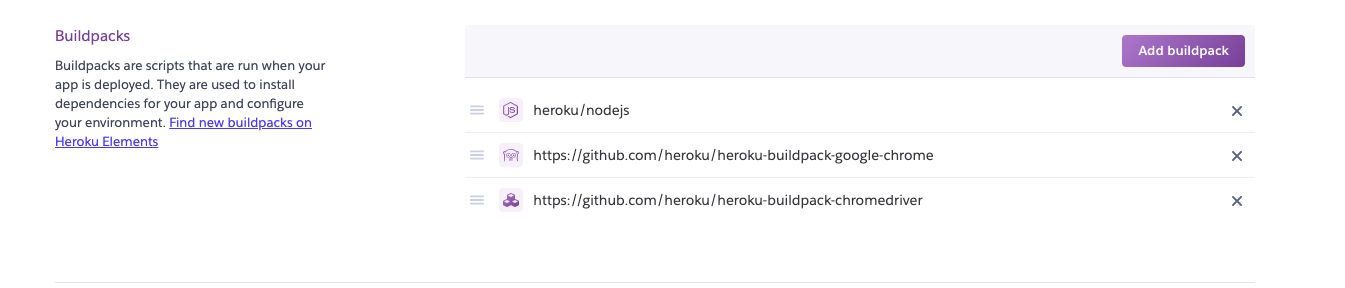
In addition to the nodejs buildpack you need to add following ones for the worker to run correctly:
- https://github.com/heroku/heroku-buildpack-google-chrome
- https://github.com/heroku/heroku-buildpack-chromedriver
Docker
There is a functional Dockerfile in the project which you can use to host somewhere.
And with the docker-compose up command, you can spin up the whole dev environment.
In the /docker folder you’ll find three dockerfiles
audit-worker.dockerfile
This dockerfile is the worker. The worker communicates with lighthouse and performs audits for all scheduled pages. My recommendation is to run this container regularly. The more regular you run this, the faster is the response, when you manually dispatch an audit in the UI
I recommend running it every 10 to 30 minutes
scheduler.dockerfile
This dockerfile is responsible to schedule all available sites. I’d recommend running this container on a regularly base with a cronjob like every 6 or 12 hours.
server.dockerfile
This is the main application. This provides the UI / Dashboard to be accessible via the Browser.
Of course you can just collect data the audit-worker.dockerfile and scheduler.dockerfile and implement
your custom reporter to monitor the data on any other platform like quickmetrics
Customizing
Add custom menu entry
There is a possibility to add additional entries to the projects menu. This is useful if you want to provide some quick access to 3rd party tools like cssstats
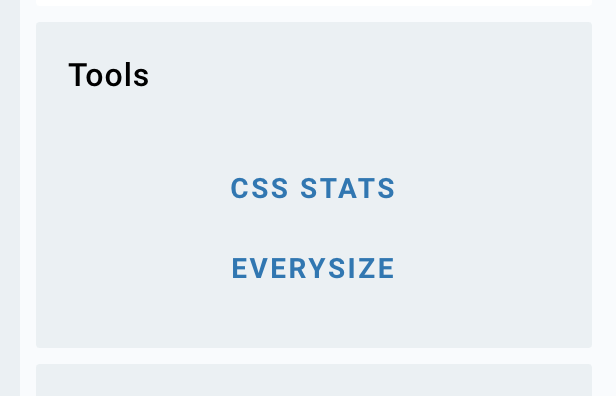
To add those entries simply edit the config/dashboard.js and add an entry to PROJECT_MENU_CUSTOM_ENTRIES.
The entry has to look like this
{
    name: 'CSS Stats',
    link: function(url) {
        return `https://cssstats.com/stats?url=${ url }`;
    },
},
where name is the name printed in the UI and link is a function which will be called with the projects url to generate the link for the new page
Add custom reporter
Checkout the Reporters documentation Reporters